

Social Sensing: Geo-social Media Data for Real-time Decision Support in Disaster Management

Prof. Dr. Bernd Resch, University of Salzburg, Department of Geoinformatics
Sebastian Schmidt, University of Salzburg, Department of Geoinformatics
User-generated data today is widely recognised as a valid and high-quality data source. While early approaches to analysing user-generated data often used simple visualisation techniques and analysis methods, more sophisticated and methodologically demanding information products have been developed in recent years. For processes and applications in decision support, this means that a valuable addition to the information base for decision-making exists beyond traditional remote sensing and GIS-based information.
This development is facilitated by the current explosion of user-generated data sets, for example, in social media, supported by the immense proliferation of smartphones, new wearable sensor technologies, and rapidly changing communication behaviour. This includes posts on social media, activities in mobile networks, digital communication platforms, eDiary apps, or microblogs. These data, often explicitly geocoded, can be evaluated in a multimodal (semantic-sentiment-geographical-temporal) way, allowing for individual, intersubjective observations to be incorporated into the analysis and visualisation of geographical processes.
Geo-social Media Information in Disaster Management
Leveraging user-generated data in has recently heavily profited disaster management processes and operations. This particularly applies to the use of geo-social media, which refers to social media posts with explicit georeferencing, as a data source. Figure 1 shows an analysis of geo-social media for Hurricane Harvey in the USA. The grid cells (red-blue gradient) indicate significant hotspots or coldspots, that is, spatial concentrations of semantically relevant posts, in which people express their observations about the disaster. The red-coloured grid cells represent significant hotspots where tweets related to the impact of the hurricane (e.g., floods and building damage) are spatially concentrated. In contrast, the blue-coloured cells represent coldspots, indicating that many tweets were sent, but only a small fraction of them is relevant to the disaster situation.
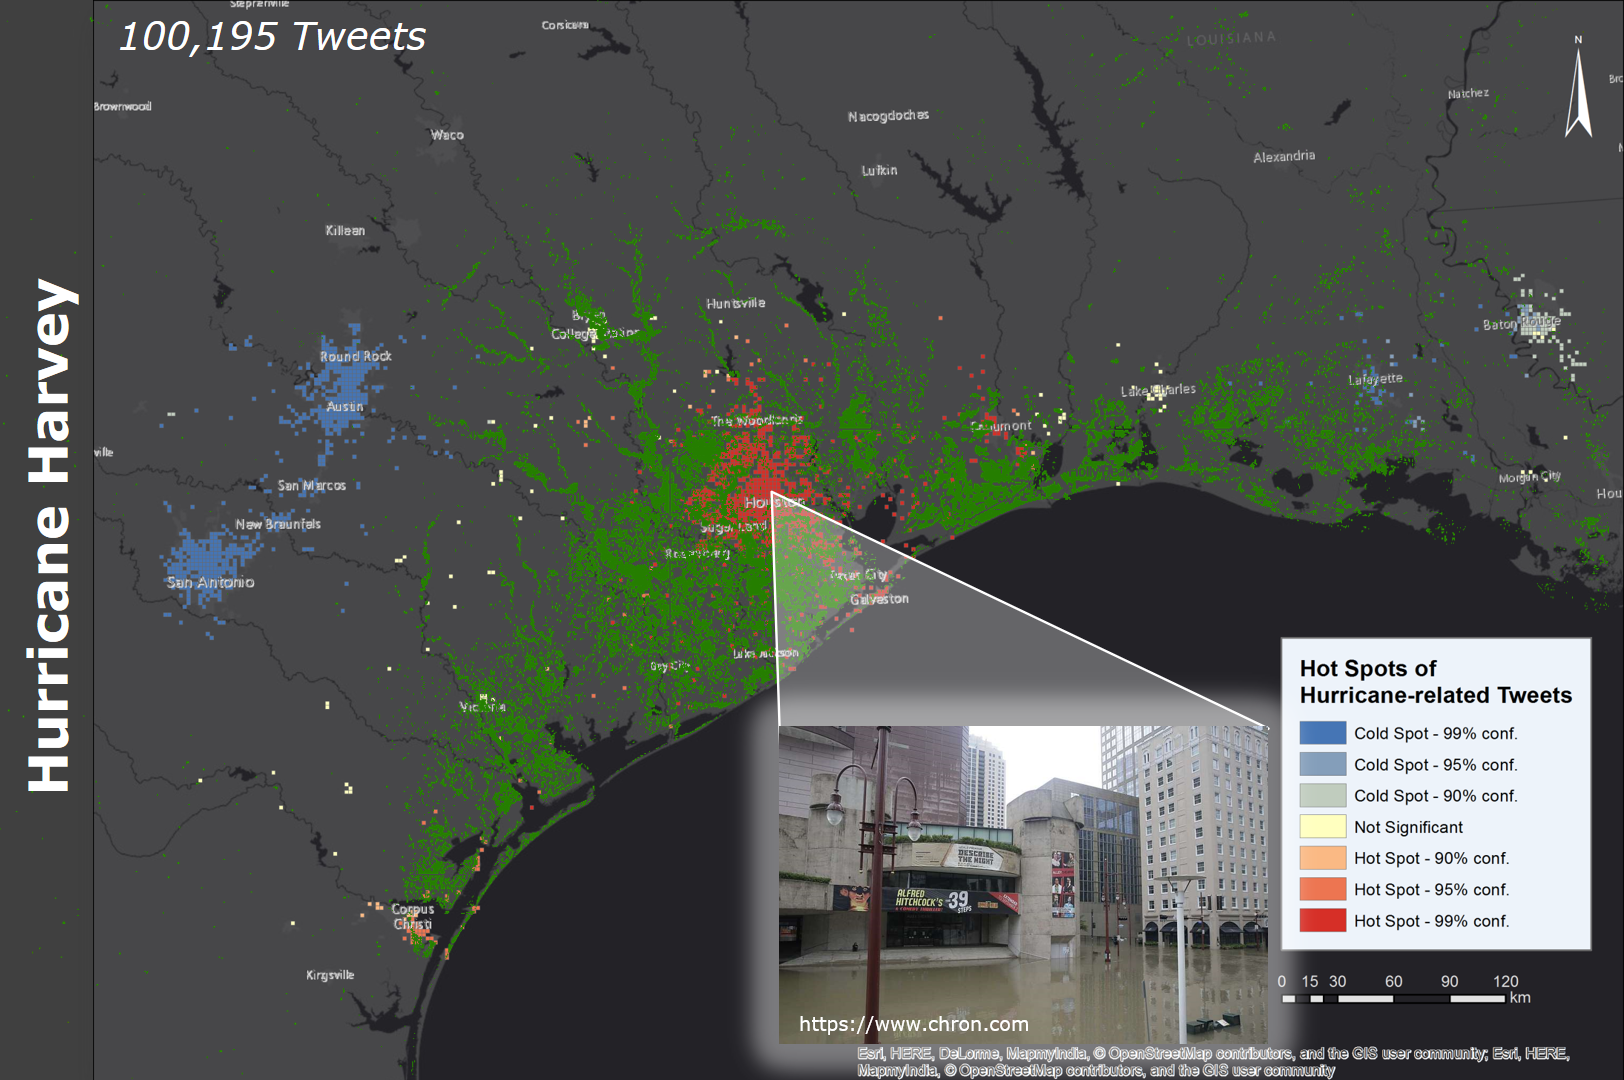
Figure 1: Geo-social Media Hotspots (red-blue) for Hurricane Harvey. ((c) PLUS, Bernd Resch)
The green-coloured cells represent the remote sensing-based information from analysis of satellite data by the Dartmouth Flood Observatory. It is noticeable that the satellite information achieves very good coverage, particularly over large areas. However, no flooding is detected in the centre of Houston due to well-known limitations of remote sensing technologies (shadowing, reflections, refraction, multipath effects, etc.). However, the geo-social media based information layer exhibits a strong hotspot, which can be verified through a visual examination of the actual water level (see picture-in-picture at the bottom right).
This allows for the assertion that tweets accurately represent flooding events in terms of their spatial and temporal extent and development. In turn, this means that suitable and complex AI analysis methods allows for the delineation of areas affected by flooding, and furthermore, an assessment of possible damages. Yet, the central strength lies in the combination of geo-social media with other information sources to achieve accurate and spatially extensive coverage through the use of innovative information fusion methods.
Usability and Transferability
Geo-social media analytics have already been tested and used in numerous real-world deployments, supporting organisations like the Red Cross, Médecins Sans Frontières (MSF), German Civil Protection THW, Johanniter, a.o. and a number of governmental institutions. On the one hand, these applications encompass a wide range of disaster management scenarios, such as the widespread floods in Central Europe, particularly Germany, in 2021, or the devastating ammonium nitrate explosion in Beirut in 2020. Other use cases included the COVID-19 pandemic (Germany, USA), the refugee situation in the Middle East and Southeast Europe, or the hostilities in Ukraine.
In all the mentioned cases, information for decision support has been provided in near real-time and high update frequencies (up to every half hour), as well as at a very high spatial resolution. This partially solves one of the traditional problems in event analysis, where data can only be captured at a specific time and with low temporal resolution, which is insufficient for evaluating and managing time-critical situations.
A crucial added value is the global applicability of the analysis of geo-social media. This applies to independence from geographical regions, languages, and use cases, enabling comprehensive and generic decision support for various domains, customers, and stakeholders. Figure 2 shows a dashboard for the dynamic exploration of posts in geo-social media. This allows for semantically filtering and spatio-temporally visualising of hundreds of millions of geocoded posts from social media. In addition to a traditional map representation, language distributions, sentiment information, temporal trends, and individual post contents (text, images, videos) can be directly visualised and filtered in the dashboard.
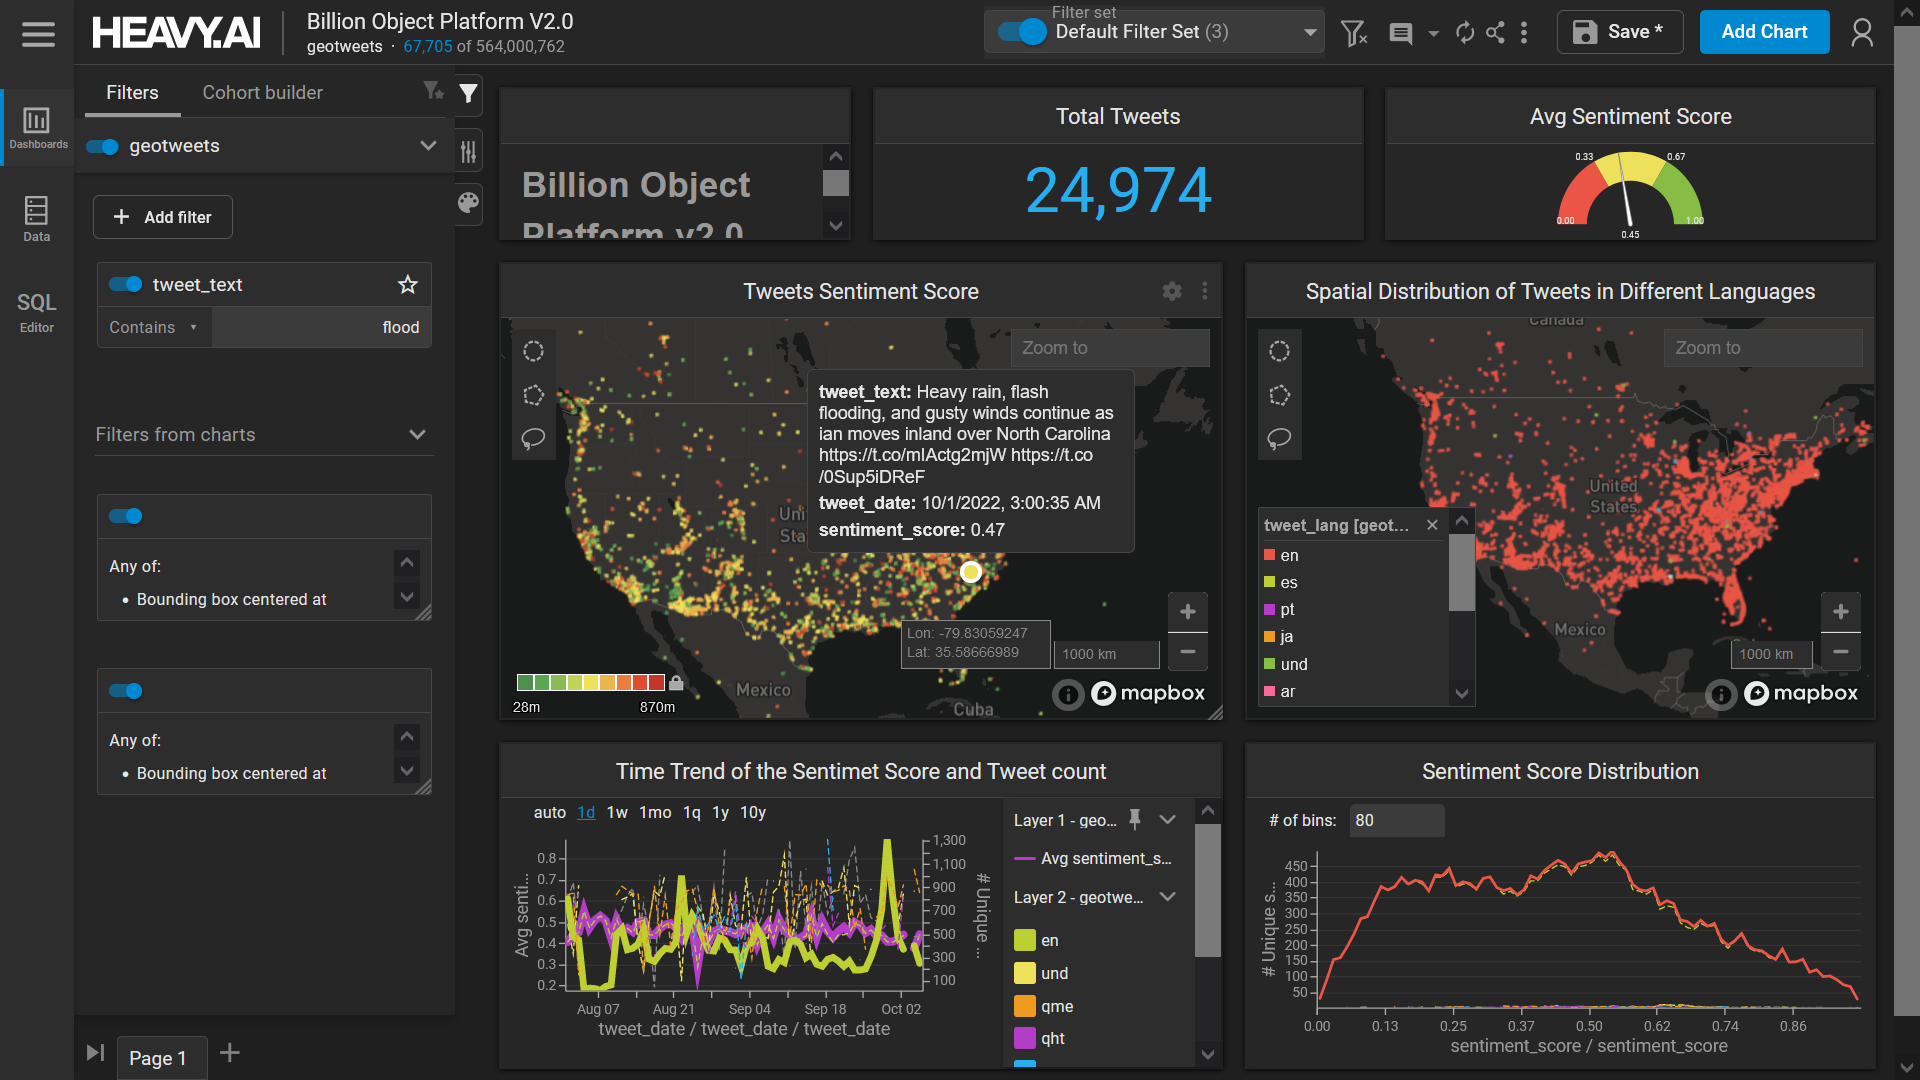
Figure 2: Geo-social Media Dashboard. ((c) Harvard University, Bernd Resch)
TEMA: Beyond the State of the Art
However, a crucial challenge, which will be tackled in the TEMA project, is the development of generic methods for combining different types of data, such as remote sensing sensors and geo-social media. This concerns both technical and methodological advancements, but especially the adaptation of processes in decision support in practice. User-generated data and information resources are often not yet considered as fully-fledged components for situation assessment and management, despite their unquestionable reliability.
Although the analysis of user-generated data is still a broad research field, it is about to reach market maturity. For example, basic analysis of geo-social media is offered as a bookable service by Spatial Services GmbH, a spin-off of the University of Salzburg. Previous applications include disaster management, epidemiology, anticipation of refugee movements, and urban planning. Therefore, user-generated data, especially posts from geo-social media, provide a valuable decision-making foundation with very high spatial and temporal resolution, covering diverse geographical regions and application scenarios.