

Revolutionizing Wildfire Damage Assessment: Integrating Satellite and Rover Technologies with Advanced Algorithms

Mauro Manente, COO at Latitudo 40
Wildfires, with their devastating impact on ecosystems and communities, present a formidable challenge in natural disaster management. In response, a pioneering approach has been developed, synergizing satellite imagery, rover exploration, and sophisticated algorithms. This article examines this integrated methodology, underscored by three critical images: the pre-event satellite view, the post-event aerial aftermath, and a meticulously generated anomaly map. This trio of images not only visualizes the extent of wildfire destruction but also marks a significant step forward in precision damage assessment.
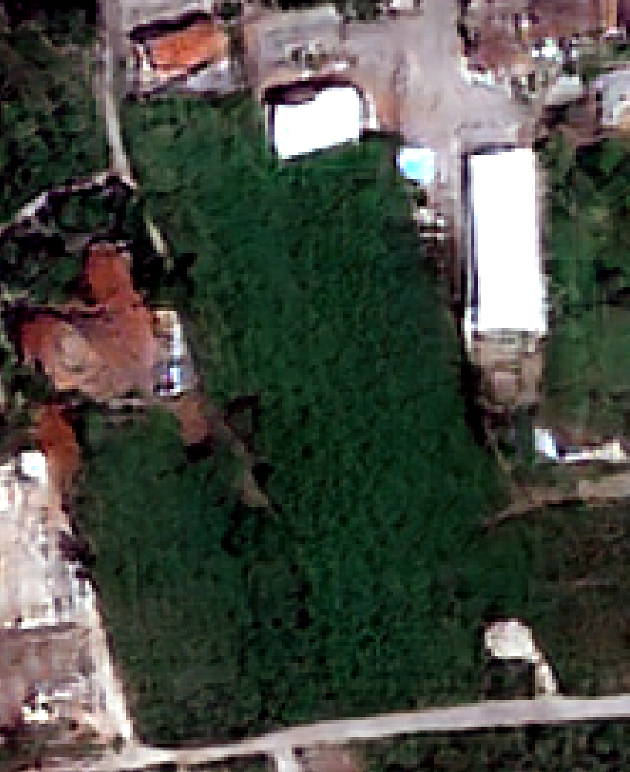
Satellite Image 1
The process begins with a pre-event satellite super-resolved Sentinel 2 image (Image 1), which captures the unaltered state of the landscape and vegetation. This image serves as a critical baseline, with special attention given to the Normalized Difference Vegetation Index (NDVI). NDVI is instrumental in assessing the health and density of vegetation by measuring the difference between near-infrared (which vegetation strongly reflects) and red light (which vegetation absorbs). High NDVI values correspond to areas of dense, healthy vegetation, providing a vital contrast to the post-event imagery.
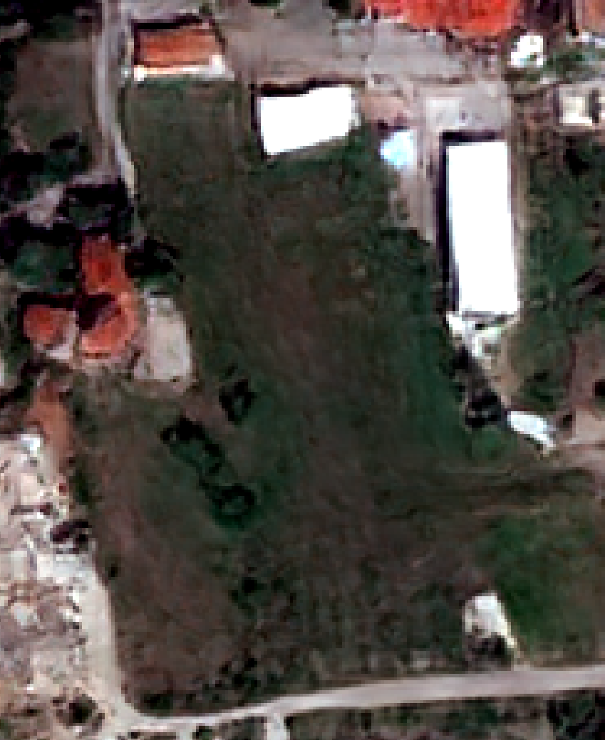
Satellite image 2
Following the wildfire, the post-event super-resolved Sentinel 2 image (Image 2) is examined. This image starkly contrasts with the pre-event NDVI values, revealing areas where vegetation has been destroyed or severely degraded. The post-fire landscape often shows significantly lower NDVI values, indicative of burnt vegetation and exposed soil. This comparative analysis between pre and post-event NDVI values lays the groundwork for a nuanced understanding of the wildfire’s impact on the vegetation.
Anomaly Detection: The Algorithmic Core
In our advanced wildfire damage assessment methodology, the Burn Area Index (BAI) is also involved in the assessment procedure, both in the pre-event and post-event analysis, enhanced by sophisticated machine learning techniques. The BAI is adept at highlighting burnt areas due to its sensitivity to the spectral properties of burnt vegetation, which are distinctly different in the infrared spectrum compared to healthy vegetation or bare soil.
Initially, the algorithm processes pre-event satellite imagery to calculate baseline BAI and NDVI values, setting a reference for the area's condition before the wildfire. After the fire, the algorithm reapplies BAI calculations to the post-event imagery, focusing on identifying significant shifts in the indexes values, indicative of burnt vegetation and altered landscapes.
The machine learning aspect of the algorithm is instrumental in this comparative analysis. It involves a detailed, pixel-by-pixel examination across the satellite imagery, employing advanced machine learning models to identify significant changes in vegetation indexes values accurately. These models are trained to discern not just numerical changes, but substantial alterations in the landscape's physical and vegetative structure, considering factors like the typical variability in vegetation and environmental conditions.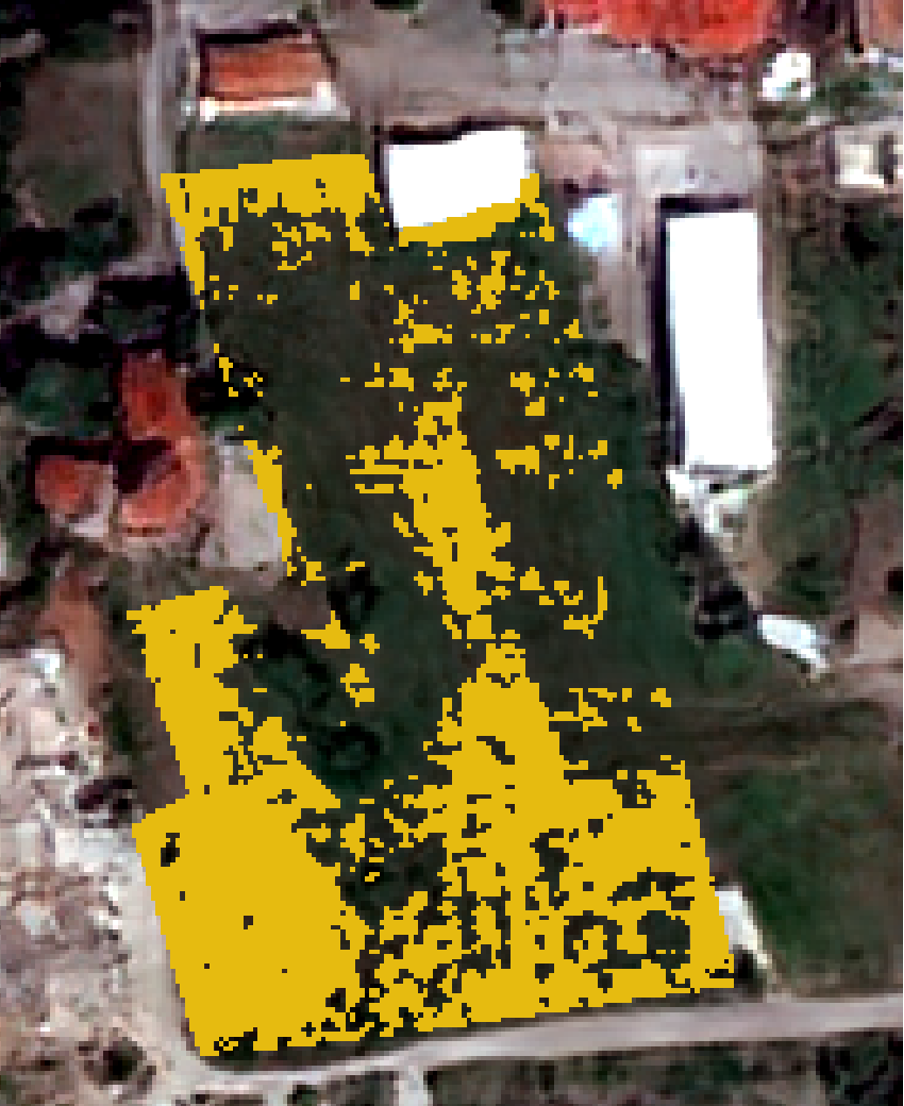
Satellite image 3: anomaly map
The outcome is a comprehensive anomaly map, pinpointing areas where the most significant shifts in BAI values have occurred post-wildfire. Each point on this map represents a specific location where the landscape has undergone severe alteration due to the fire. These points are more than damage indicators; they arefigu data-driven priorities for further detailed assessment.
Deploying Rovers: The Ground-Level Exploration
Following the algorithmic identification of key areas, the mission transitions to on-ground exploration. Autonomous rovers, equipped with state-of-the-art optical sensors, are deployed to the anomaly points. 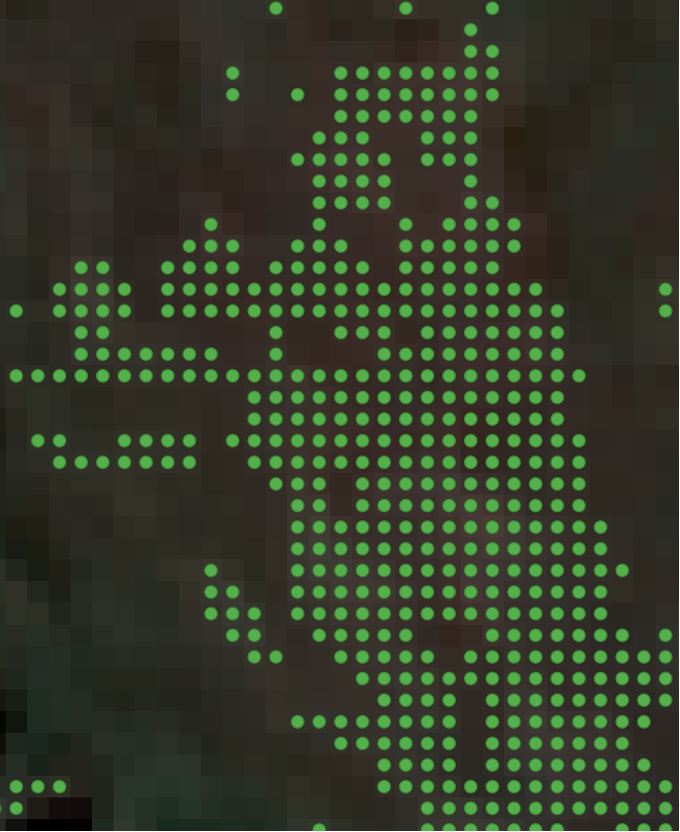
Image 4: Anomaly points
These rovers, designed for resilience and precision, traverse the challenging post-wildfire terrain. As they navigate through the damaged landscape, they collect detailed data - an in-depth exploration that satellite imagery alone could never achieve.
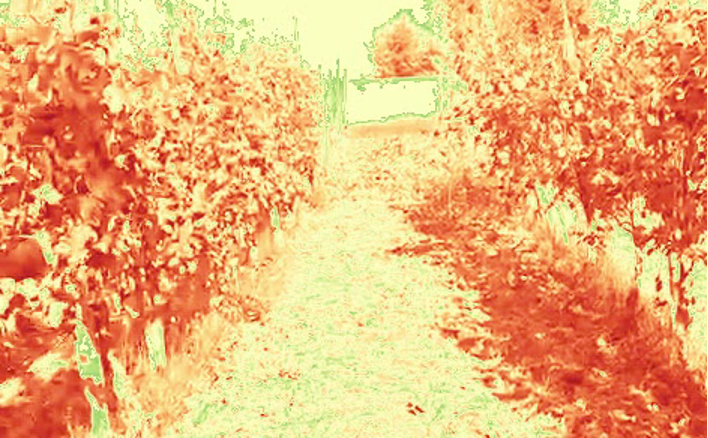
Image 5: Satellite image post-fire
This data encompasses various aspects of the damage, including the extent of vegetation loss, and leaf vigour and It is processed and streamed in real-time through a 4G/5G connection.
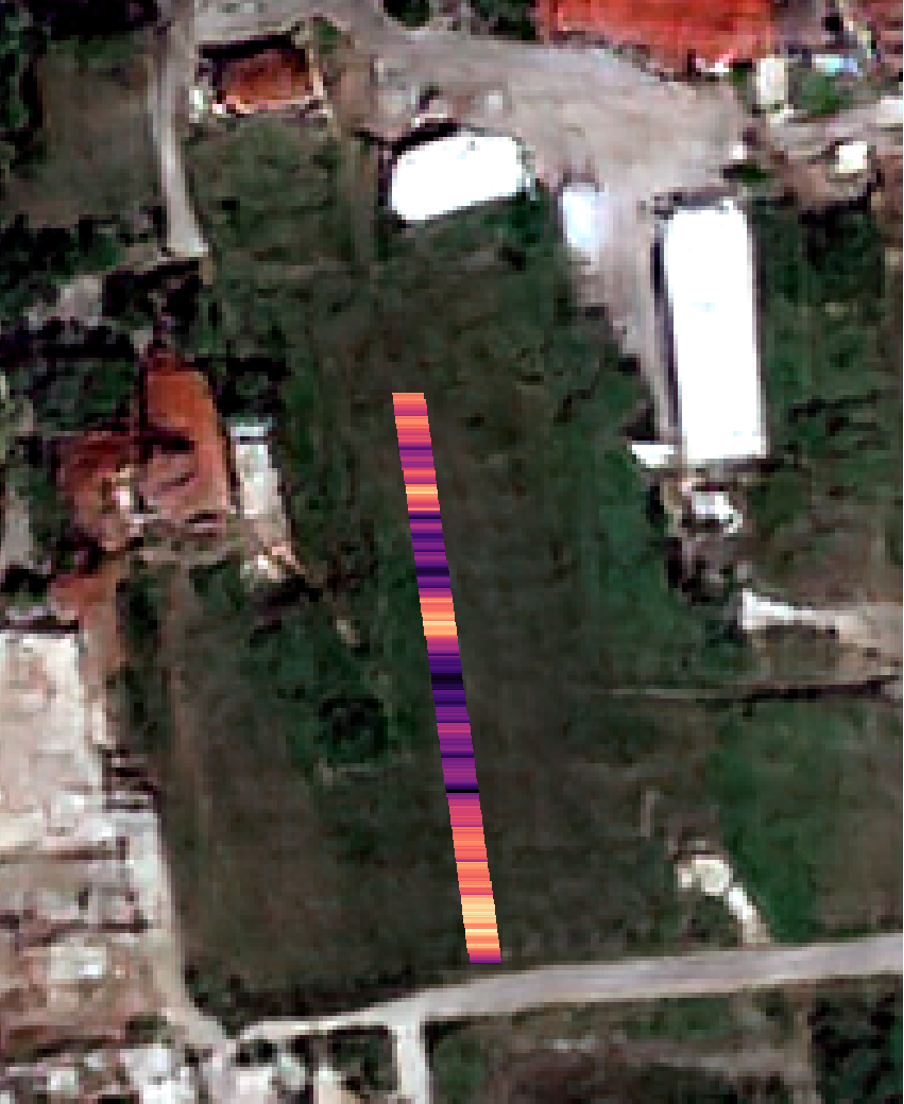
Image 6: Sattelite image

Image 7: High-Tech rover
The precision in anomaly detection afforded by the machine learning-enhanced BAI analysis is then matched with the acquisition of images through the rover.
This high-tech rover is specifically designed to traverse the affected terrain, capturing high-resolution images of pinpointed areas of interest. These images serve as a critical input for the next phase of analysis. By applying advanced algorithms, a vegetation index is calculated for each image, effectively quantifying the extent of vegetation cover and health. This process transforms the collected imagery into a 2D raster layer, offering a detailed and nuanced view of the landscape's current state. This layer, when overlaid on the anomaly map, provides a more complete understanding of the post-wildfire environment, highlighting areas of severe vegetation loss or change. Consequently, this integrated approach allows for a more targeted and effective response in post-wildfire recovery and restoration efforts.
TEMA Data Fusion: Creating a Unified Picture
The true prowess of this approach lies in the integration of satellite and rover data achieved using the TEMA toolbox. This synthesis combines the expansive view of the satellite imagery with the intricate details gathered by the rovers. It's a confluence of macro and micro perspectives, resulting in a comprehensive and nuanced understanding of the wildfire's impact.