

Improving Disaster Management with Multimodal Information from Social Media

David Hanny, Researcher / Department of Geoinformatics at PLUS
Bernd Resch, Associate Professor & Head Geo-social Analytics Lab / Department of Geoinformatics at PLUS
When a natural disaster occurs, the situation on-site can be quite chaotic and overwhelming, making it hard to understand for emergency responders. To react effectively, a detailed understanding of the situation on the ground is required, as it determines where resources and manpower are deployed. After events such as floods or earthquakes, traditional methods of information gathering and transportation are often hindered, e.g. by physical barriers or overwhelmed call centres. Additionally, official sources of information might not cover the entire region as can be the case for wildfires.
Social media as a multimodal data source
This is where social media comes in. With billions of people using platforms like X (formerly Twitter), Telegram, TikTok or Facebook, online communities have become a valuable source of real-time information before, during and after disaster. People share their experiences, ask for help, and report on what they're seeing around them. However, sifting through this massive amount of data can be a daunting task.
Social media posts contain more than one type of information – even if it merely consists of text. Each text has semantic content, i.e. what the person is posting about. Simultaneously, the text might have an emotional association. For the assessment of disaster situations especially, it makes a difference whether a person is posting in fear or happily. The former suggests a degree of urgency or need for help while the latter provides a reason for reassurance. Social media posts usually also have a posting time.
Additionally, they might come with a geo-reference, either based on Global Positioning System (GPS) coordinates or based on mentions of places in the text. Consequently, even seemingly simple textual social media posts consist of at least four layers of information – semantics, sentiment, time and geographic location. Additional information such as images and videos add even more content on top of that.
As part of the TEMA project, our research group at the Paris Lodron University of Salzburg (PLUS) is therefore working on novel methods and technologies for the analysis of such geo-social media data in extreme disaster situations. We aim to extract helpful information from the vast amounts of data available online and provide emergency responders with actionable insights to improve the handling of natural disasters.
A model that considers it all
The different aspects of social media posts are often analysed separately using sequential workflows. For instance, semantic topics are extracted independently from sentiments or geospatial analysis is conducted using the posting locations without considering the texts themselves. This limits the scope of the information.
This is where our research comes in. We developed a novel approach to analyse social media data that considers semantics, sentiments, geographic space and time all at once. It can be described as a machine learning model that provides contextualised information where and when are posting about what and how they feel about it. The output of our model was tailored to be easily understandable by emergency responders. . Our model thus provides a major technology for extreme data analytics for natural disaster management in the context of TEMA.
Under the hood
The approach we present works by grouping social media posts based on their similarity among their modalities. To achieve this, a numerical representation that captures content, emotions, space and time is computed for each post. We used various techniques from machine learning and geographic information science to achieve this. More specifically, information is extracted as follows.
- Semantic content: Our model uses powerful Large Language Models (LLMs) to understand the meaning of the posts, not just the individual words. This is important because people often use different words to describe the same situation.
- Sentiments: The model can also identify the sentiment of the posts using, whether they are positive, negative, or neutral. To compute the sentiment, complex language models are used as well.
- Location and time: Our approach also processes the location where each post was sent from and the time it was posted. This allows emergency responders to see where the most urgent needs are and how the situation is evolving over time.
By combining all this information, our model can compute groups (clusters) of social media posts that are related to each other. As it is often unknown how many distinct clusters there are, the system automatically decides on an appropriate number of clusters based on how different the posts are.
To achieve such a grouping effectively, we developed a novel spatially explicit neural network algorithm based on a neural network architecture called the Self-Organising Map (SOM). Throughout the learning process, data is presented to the network and each post is assigned to the most similar cluster of posts. If the posts within a cluster become too dissimilar, it is split up into several sub-clusters. This learning process continues until no new clusters are formed or another stopping criterion is met. Most importantly, the algorithm explicitly considers geographic space – only posts that are close in the real world are assigned to the same cluster.
In a final step, cluster-specific information is extracted from each group. A cluster label is generated using Llama-2, a state-of-the-art generative LLM, and sentiment information is calculated using statistics.
Putting it into Practice: The Ahr Valley Flood
We have tested the method on a dataset of tweets from the 2021 Ahr Valley flood in Western Germany. This flood caused widespread damage and loss of life. Our model was able to identify clusters of tweets related to different aspects of the flood.
- Warnings and evacuation notices: These clusters contained information about rising water levels and calls for people to evacuate their homes.
- Reports of damage and displacement: These groups included information about the damage caused by the flood and the people who were forced to leave their homes.
- Requests for help: These clusters contained messages from people who needed assistance, such as food, shelter, or medical attention.
By analysing this output, emergency responders could quickly get a sense of the most pressing needs in different areas and allocate resources accordingly. The flood is also one of the main scenarios we consider as a case study for the TEMA project.
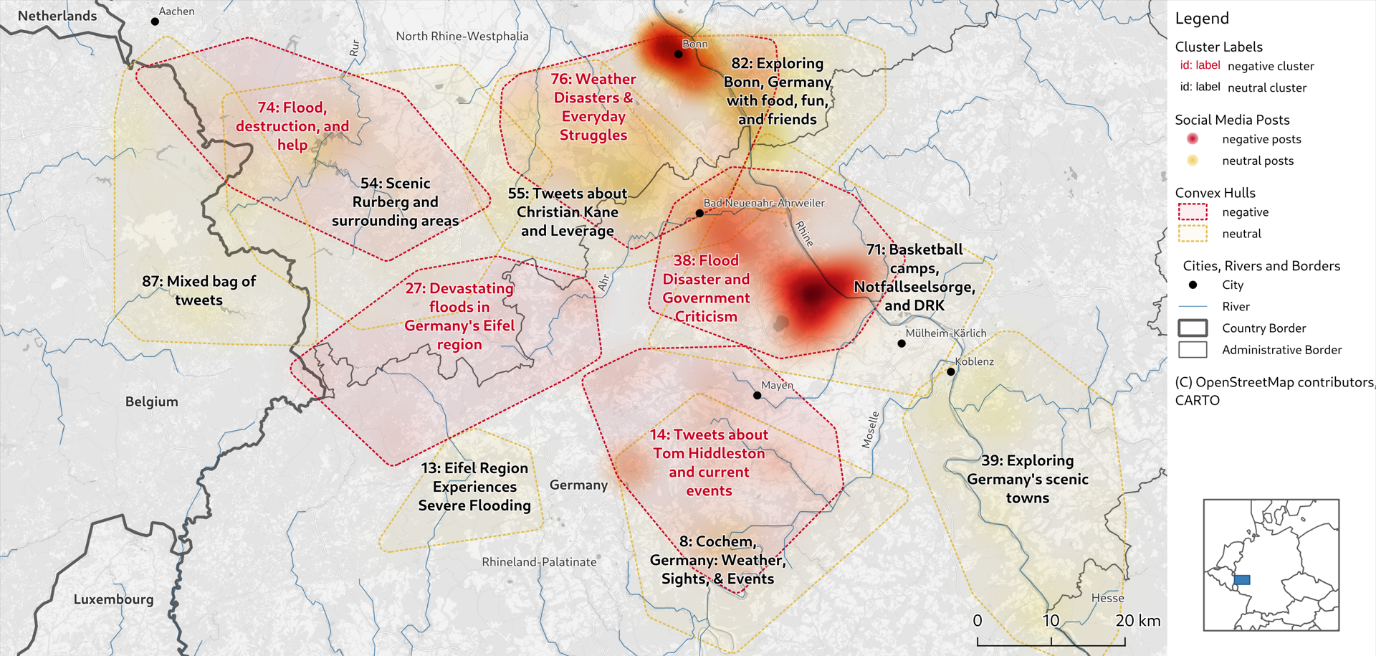
Figure 1: The clusters computed by our model for the 2021 Ahr Valley flood in Germany.
Applications in the real world
Our model has the potential to be a valuable tool for emergency responders around the world. It can be used to improve the situational awareness of responders during disasters, allowing them to make better decisions about how to allocate resources and save lives. The approach is also flexible and can be adapted to different types of disasters. For example, it can be used to analyse social media data from earthquakes, wildfires, or other events that cause widespread disruption. Throughout the TEMA project, we aim to integrate our technology into the TEMA platform to provide emergency response entities with insightful information and visuals about the disaster at hand.
It's important to note that this technology is not meant to fully replace human judgment. Emergency responders will still need to use their expertise and experience to make decisions. However, our model can provide them with valuable insights that can help them to be more effective in their work. In the future, we hope to develop the approach further so that it can provide even more actionable information to emergency responders. We also plan to work with disaster managers to test the method in real-world situations.
Currently, there are a total of three research papers under review examining different aspects of our development. If you have any questions, please contact either david.hanny@plus.ac.at or bernd.resch@plus.ac.at. For updates on our research, follow us on LinkedIn (www.linkedin.com/company/geo-social-analytics-lab) or check out our website (https://geosocial.at/).